The Sonnet Virus, 1555-1640: Motion Chart
First and Single Editions: Motion Chart
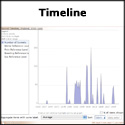
The chart played in its initial state clearly demonstrates the significant role of printed love sonnet sequence in the sonnet vogue of the 1590s. It charts along the x-axis the number of sonnets in each theme cummulative over time and along the y-axis the total number of new sequences published each year. Each bubble represents a unique sonnet sequence (colored by author) and its size corresponds to the number of sonnets in the sequence. Notice the sheer number of love sonnets over time, in comparison to religious or miscellaneous sonnets. Use the menus to change the axes and size and color of the bubbles to gain insight into trends in printed sonnet sequences from more angles. |
The Sonnet Virus, 1555-1640: Motion Chart
Focus on Sidney, Daniel, Constable, & Drayton
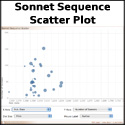
The chart played in its initial state highlights the roles of Philip Sidney, Samuel Daniel, Henry Constable and Michael Drayton in relationship to the the love sonnet vogue of the 1590s. It charts time along the x-axis and the total number of new sequences published each year along the y-axis. In this state, each bubble represents a unique sonnet sequence and the size of each bubble corresponds to the number of sonnets in the sequence. Notice the apparent lull in sonnet sequnce publication immediately after Sidney's Astrophil and Stella. This dip in the graph suggests that 1592 was a highly productive year for the writing of sequences, subsequently published in 1593 and 1594. Use the menus to change the axes and size and color of the bubbles to gain insight into trends in printed sonnet sequences from more angles. |